
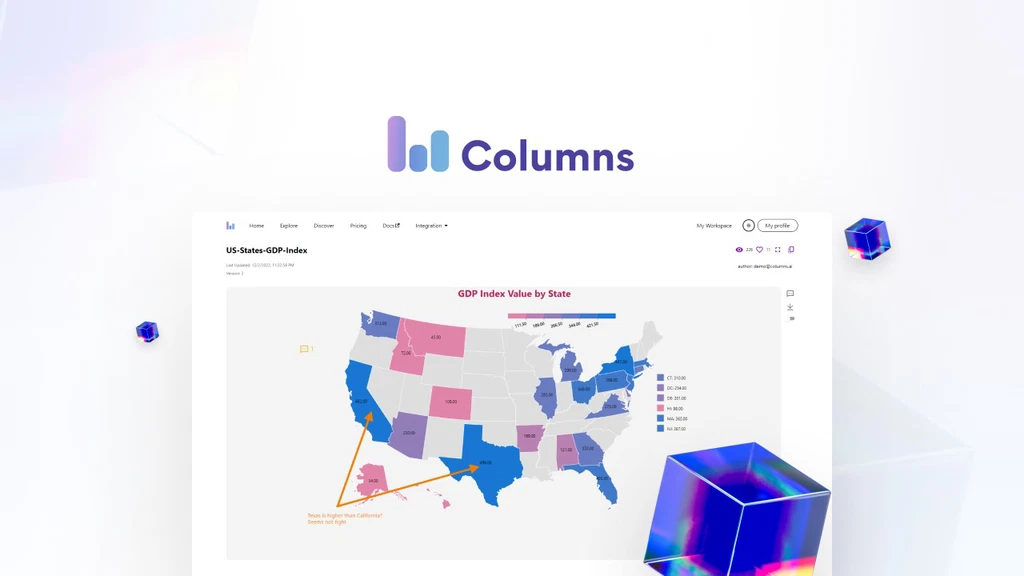
Columns is a smart AI tool that helps you turn your data into clear, visual stories. No need to be a designer or analyst. Just connect your data, chat with the AI, and get beautiful results. It’s perfect for people who want simple, fast, and powerful data visuals.
Key Features
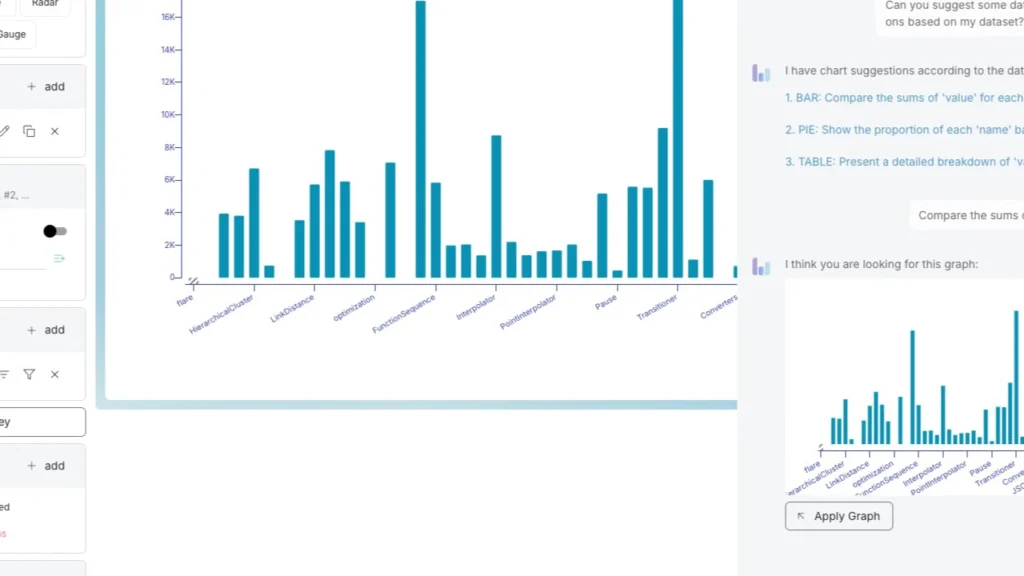
AI Chat to Build Stories
You can talk to Columns like a friend. Ask it to create graphs, filter data, or apply themes. It listens, understands, and builds your data story in seconds.
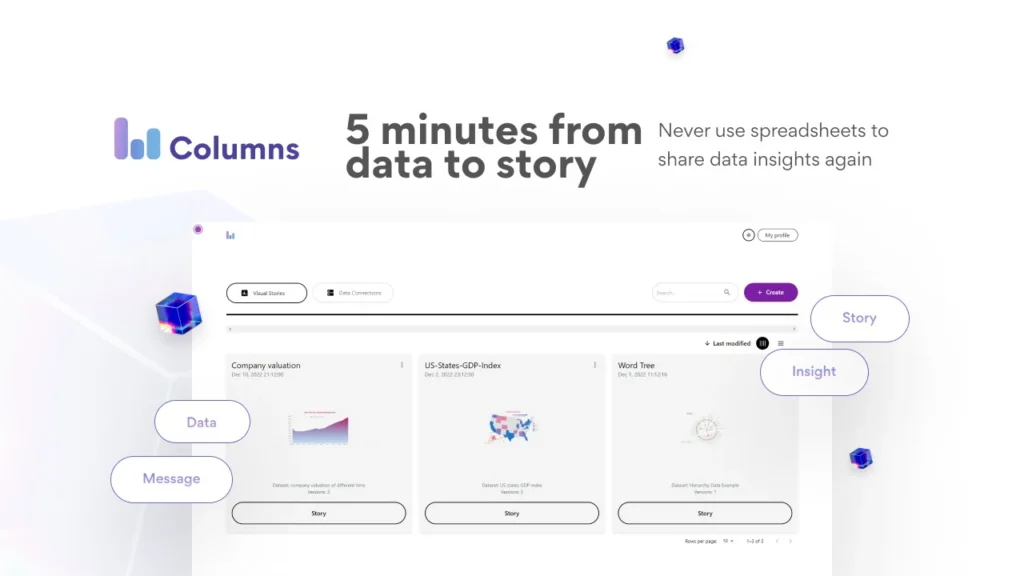
Connect Your Data Easily
Columns works with tools like Google Sheets, Notion, Excel, and SQL. You can also connect APIs. It’s plug-and-play—no setup headaches.
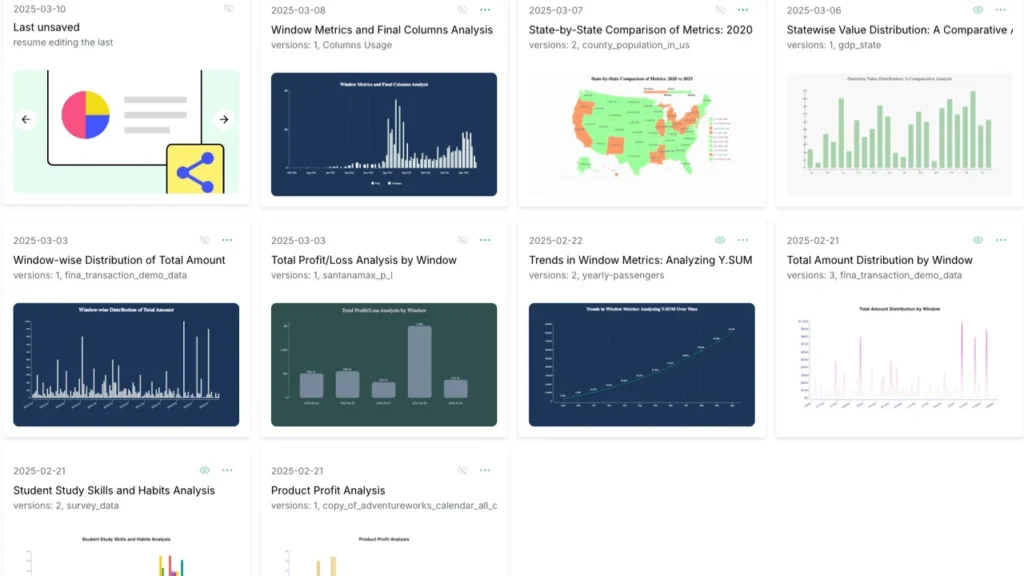
Design It Your Way
Pick colors, styles, and layouts that match your brand. The canvas is fully flexible, and AI can even help with design ideas.
Live Updates
Set a schedule, and Columns will refresh your stories on its own. You never have to update charts by hand again.
Share Anywhere
Each story comes with a shareable link or embed code. You can drop it into websites, reports, or emails.
Use Cases
Consultants
Build client-ready dashboards fast. Use live data and share links that auto-update—no more sending new files every week.
Educators
Make learning fun and visual. Turn spreadsheets into clean, clear graphs your students will love.
Marketers
Show ad results, sales trends, or social media stats. Share them live on client portals or dashboards.
Teams
Collaborate on data stories. Everyone sees the same thing—fresh, styled, and ready to go.
Pros and Cons
| Pros | Cons |
|---|---|
| Very easy to use | Not built for raw unstructured data |
| Clean, modern design options | One user only (in base plan) |
| Works with many data sources | No mobile app yet |
| Stories update on their own |
Hands-On Experience / My Honest Opinion
I tried Columns with my Google Sheets data. Within minutes, I had a live dashboard that looked polished and professional. The AI chat felt smooth and helpful. It asked smart follow-up questions and adjusted my charts in real time.
What stood out was the auto-update. I no longer worry about stale charts. Columns handles it all. For $79 as a lifetime deal, this tool is a hidden gem. It won’t replace deep BI tools, but for fast, visual storytelling—it’s hard to beat.