
If you work with spreadsheets, InstaCharts can save you time. It turns your data into clean, simple charts in just a few clicks. You don’t need to know code or design. Just upload your file and let InstaCharts do the rest.
Key Features
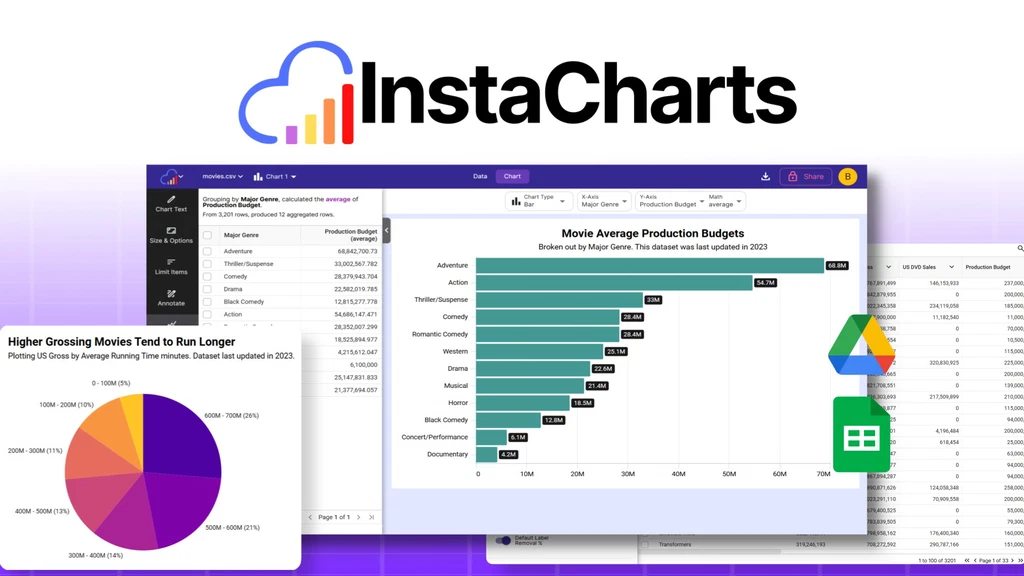
🚀 One-Click Chart Creation
Upload a spreadsheet or link your Google Sheet. InstaCharts will scan the data and build a chart for you—fast and easy.
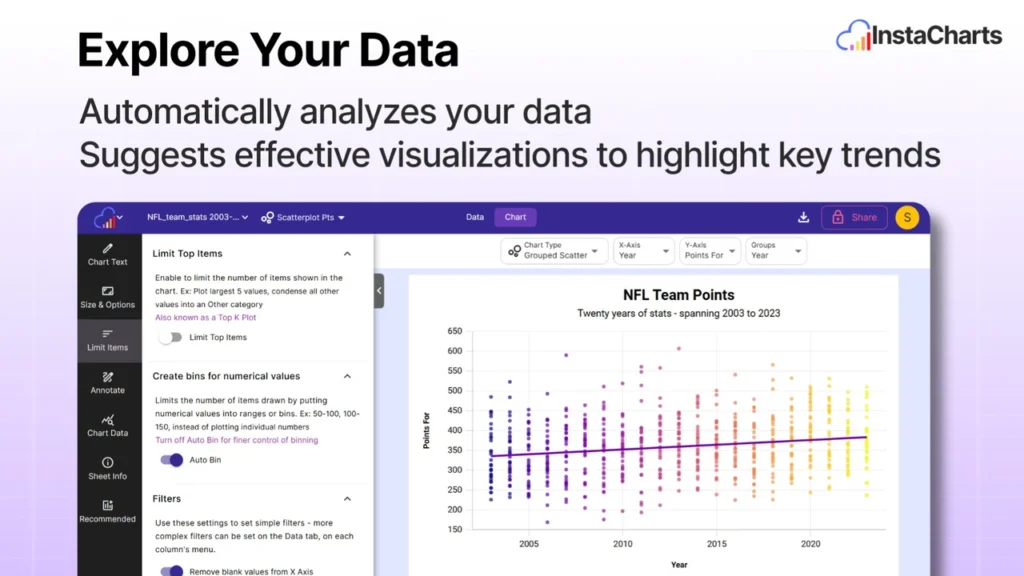
🧠 Smart Chart Suggestions
Not sure which chart fits best? InstaCharts picks the right chart to show your trends and patterns clearly.
🔄 Google Sync & Auto Updates
Pull live data from Google Sheets or Drive. Set it to refresh every hour, day, or month.
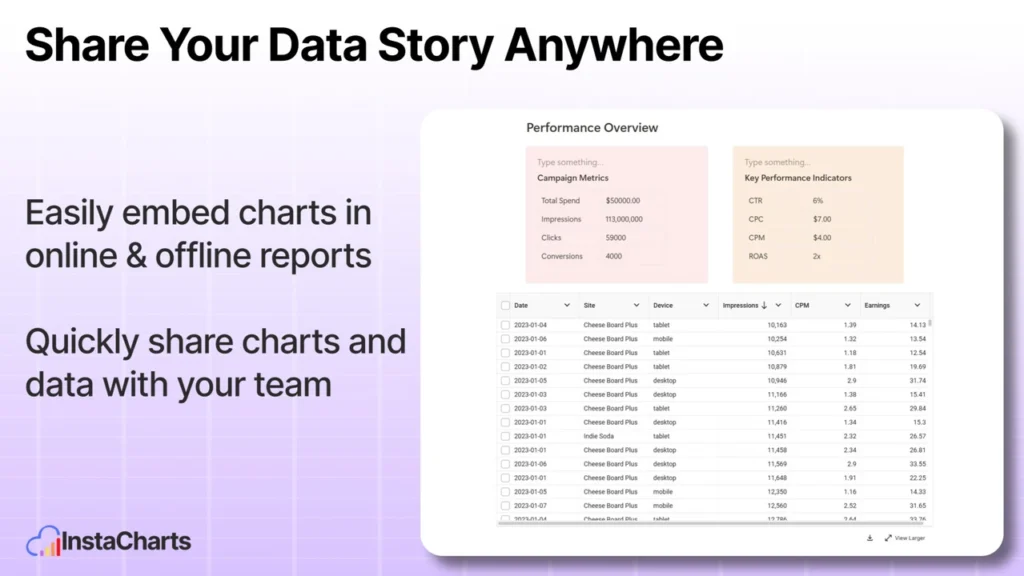
📤 Share and Export Easily
Download charts as .svg or .png. Or share public links and embed them on your site or blog.
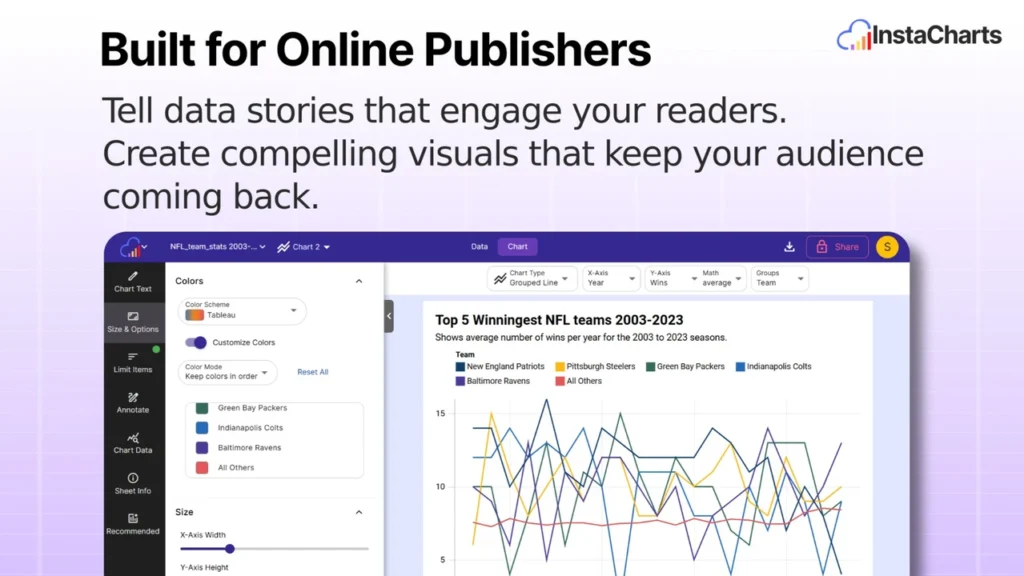
🌐 Interactive and Embeddable
Add live charts to WordPress, Notion, Substack, and more. Your viewers can explore the data without leaving the page.
Use Cases
- Freelancers: Send clean, easy-to-read charts to clients. Save hours on design and formatting.
- Marketers: Show campaign data and traffic trends. Share results with teams in a simple, visual way.
- Consultants: Use live charts in reports or meetings. Keep data fresh with auto-sync from Google Sheets.
- Teachers & Bloggers: Add charts to lessons or blog posts. Help readers learn through real-time data visuals.
Pros and Cons
| Pros | Cons |
|---|---|
| Easy for beginners | File size limits (10–20 MB) |
| Smart chart suggestions | Only 10 chart types |
| Syncs with Google tools | No free plan listed |
| Embeds work on most platforms | — |
My Honest Opinion
I tested InstaCharts using a CSV and a Google Sheet. It took less than a minute to build my first chart. I didn’t touch a single formula.
The smart chart tool picked the best format for my data. Embedding on WordPress was smooth. I liked that charts could update automatically from Google Sheets—great for live dashboards or reports.